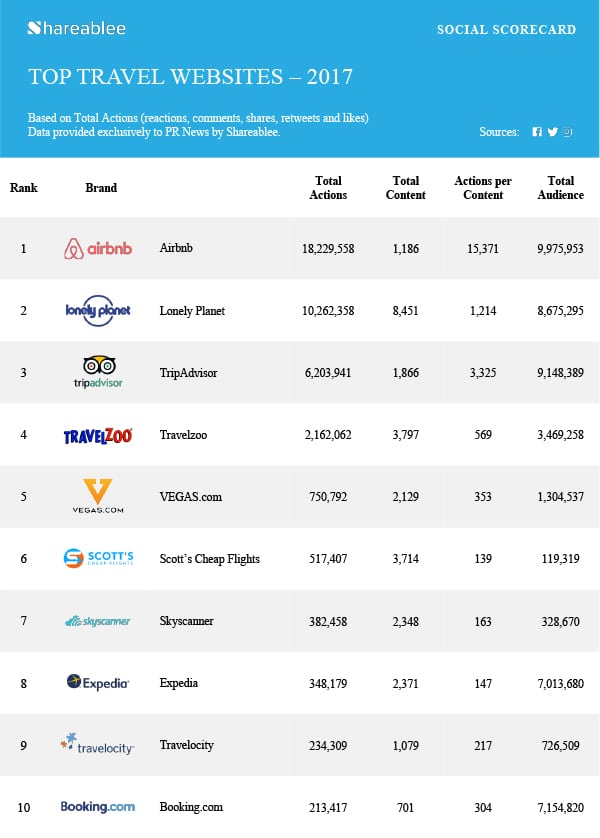
We continue our examination of consumer engagement with brands’ social posts during 2017, with data provided exclusively by Shareablee to PR News. This week we look at the top 10 travel websites, ranked by consumer engagement, shown as total actions on this chart.
Travel sites generated 42 million consumer actions and 156 million video views across Facebook, Twitter and Instagram in 2017. Despite posting 4% fewer pieces of content, the category saw a 70% growth in consumer engagement, a 77% increase in actions per post and a 91% rise in consumer actions with videos year over year. Videos posted rose 28%. All this indicates a change in content strategy and an increase in quality, says Shareablee’s Ron Lee.
Travel sites generated 72% of their consumer engagement from Instagram, 25% (10 million) from Facebook and 3% (1.4 million) from Twitter, Lee says. Facebook engagement rose 18% vs 2016, while Instagram achieved a 119% increase. Twitter dropped 5%.
Regarding individual brands, Airbnb, which also dominated in 2016, maintained its leadership position last year with 18.2 million actions, an impressive 148% increase in engagement, along with a 99% increase in content shared. Interestingly, Airbnb bucked the trend, posting 46% fewer videos in 2017, yet video views rose 79%, Lee says.
Lonely Planet at #2 saw a 70% increase in consumer engagement despite a 2% drop in content posted. Video actions and video views both rose by triple digits.
TripAdvisor enjoyed 120% growth in engagement and a 758% rise in video views.