More and more communicators today need to measure competitive media coverage on a global basis, and can be overwhelmed by the sheer complexity of the process. How can they ensure they are listening to the most important channels, keeping tabs on competitors and are being protected from unwelcome surprises?
In the Internet age, your organization is already on the world stage—whether it wants to be there or not. The following seven-step process will help you take your media measurement beyond domestic borders.
Step One: Research
As in all PR work, begin by deciding exactly what you wish to achieve with your international program, and define measurement from there. Internal research starts with stakeholder surveys or meetings to determine what spells “success” to them. Next, look at your current measurement process and see if there are gaps between expectations and what you are providing. Then, if you haven’t already, work through an overall measurement plan that includes:
• Define organizational goals;
• Define and prioritize audiences of importance to reaching those goals;
• Set PR objectives against each audience that are specific and measurable (like attitude and awareness goals, sales leads, loyalty, etc.);
• Determine how you’ll measure each objective, with what tools, and benchmark;
• Choose how you will link results with objectives; and
• Measure continuously and adjust programs as you go.
Once this is in place, you’re ready to tackle the measurement side.
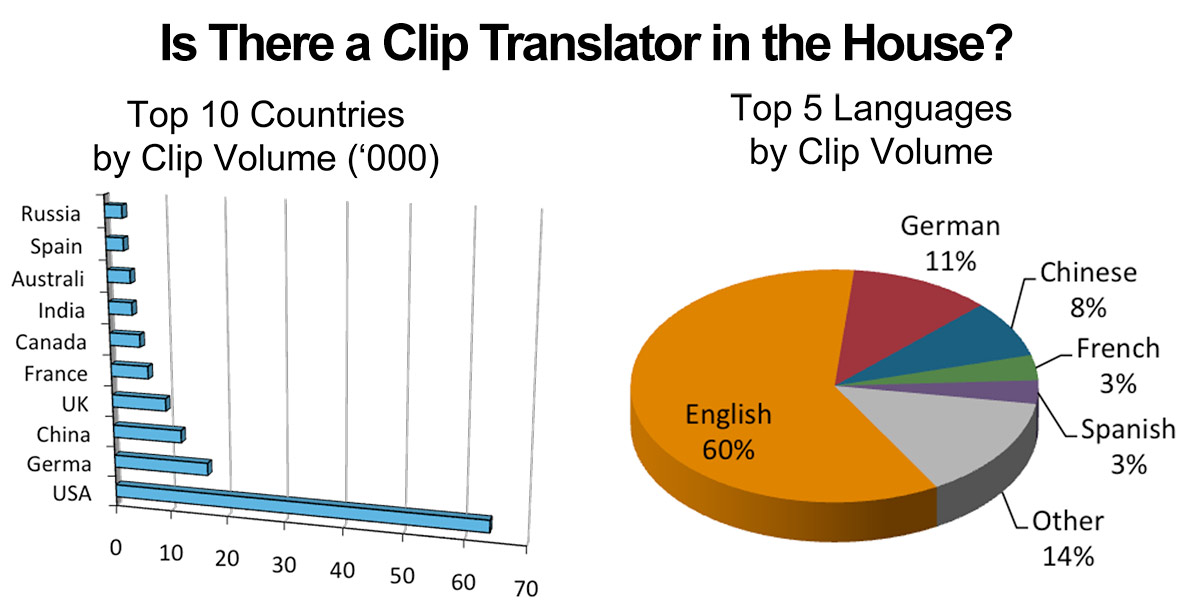 |
| In this snapshot of clip volume culled from online news and information sites (coverage from Oct. 2010 to March 2011), clips from the U.S. reign, yet 40% of those clips are in languages other than English, underscoring the importance of translation. Source: Angela Jeffrey |
Step Two: Media Content Selection
Consider the following criteria when choosing media content to monitor:
• Countries and Languages— Media content can be expensive, so which countries and languages are most critical, and which are “nice to have’s”?
• Media Sources— You may think you want every clip, but many organizations have found better success with selecting the most critical sources from each country and prioritizing them into Tier 1 and Tier 2 lists.
• Selecting the Content— To begin budgeting, you’ll need an estimate of how many clips your firm (and competitors) garnered in the previous months. Then decide which types of clips you need. They include:
1. Traditional Media: If you are a B2C organization, for example, you’ll probably need images, so actual print and broadcast clips may be required.
2. Internet and Social Media: Do you need every citation, or can you live with a sample of most-critical sources?
3. Client-Supplied Clips: If your organization is decentralized and communications teams in other countries already have clip providers, you may be able to have those clips passed on to your analysis firm.
Step Three: Dashboard or Narrative Reports?
Consider these three types of reports:
• Narrative Analysis Reports: If your business is complex and you need outside counsel to analyze data and make recommendations, the least-expensive method is to forego receiving clips and contract only for reports.
• Real-time Dashboards: If you want to see the clips and have them analyzed on a real-time basis, there are plenty of dashboards on the market that offer this type of service with attractive charting and graphing capabilities. The downside is the analysis will contain major inaccuracies since it will have to rely on automated translations and sentiment, not to mention it will contain a lot of invalid clips. Costs shift to your internal staff having to pick through the data for better results.
• Near-Time Dashboards: A great way to get the best of both worlds is to choose a “near-time” dashboard solution in which the clips go through a human analysis process before being posted on your site. This is not only more accurate, it saves time.
Step Four: Determine Analysis Types
There are three types of analysis: artificial intelligence, human analysis or a combination of the two. Artificial intelligence is instantaneous and relatively cheap, and is best used for categorizations and topic identification. But it falls apart on sentiment (which is, at best, 65%). Human analysis can be up to 95% accurate, but is more expensive. A combination is great where you derive overall trending from artificial analysis, and have humans analyze Tier 1 and 2 lists.
Language is a big consideration in global analysis. Translation work is very expensive, and automated translations are substandard if you are looking for accurate analysis. The best remedy is to use a firm that has in-country analysts spread across the globe who can score clips in the original language, and then upload just an English summary.
Step Five: Select a Provider
Many firms claim international capabilities, but here are five important questions to ask:
1. What types of international experience have they had, and which clients have they served?
2. Do they know local markets?
3. How is language handled?
4. Can they offer customized solutions?
5. What kind of in-country management do they have?
Step Six: Sell It
Once you have your measurement program organized, it’s time to go on the road and sell it to management, potential internal users and other stakeholders. Make sure you have everyone’s backing. Allow time for program ramp-up, clip collection, scorecard customization and user training.
Step Seven: Evaluate Results
If you have chosen an automated monitoring and analysis system, your final reporting will be limited to some overall trending through charts.
If you’ve chosen some form of human analysis, you’ll have a wealth of information from which to glean insights. Now, go talk with your marketing or finance departments to see who can run some correlations against the business outcomes you identified as your objectives—data such as survey scores, leads, sales, etc.
This is when it gets exciting—when you can see that in Norway, your efforts helped change perceptions of a brand, and sales rose 10%. Now that’s global measurement at its best.
CONTACT:
This article was written by Angela Jeffrey, APR. She is a member of the IPR Commission on Measurement and Evaluation and can be reached at [email protected].