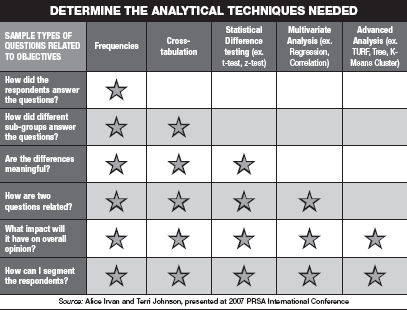
In tandem with this week's feature on implementing effective Web-based surveys, additional attention should be taken to determining the best analytical techniques, as a poorly
thought-out choice could completely negate the results' validity. Here, with the help of an analytical breakdown chart provided by Alice Irvan (president, AIRvan Consulting) and
Terri Johnson (assistant professor, Eastern Illinois University) at the 2007 PRSA International Conference, is a guide for making the best choice before any damage is done.
*Know ahead of time what you are looking for: It sounds obvious, but skipping this step will guarantee ineffective findings. Consider your audience and your desired
objectives. Will you be grouping responses into sub-categories? Will you be comparing multiple subgroups? How many response options will be available? Answers to all of these
questions will be key in taking the proper steps to analyze data.
*Consider the options: Analysis is the process of turning data into actionable information, the key word being "actionable." Analytical techniques include graphical analysis,
frequency tables, cross-tabulations, filters, and regression analysis.
*Choose a technique that complements your set objectives: Cross-tabulations are best suited for comparing sub-groups of information: male versus female, national versus
international, etc. These results can be displayed in a table that shows the breakdown in a clean format.
Graphs, on the other hand, are good for visualizing results, and they are useful when presenting results to media and in meetings. They also make it easy to identify patterns
and inconsistencies. However, this analytical technique does have its limitations: It does not easily accommodate surveys with a lot of questions and sub-groups of respondents.
Frequency tables show a basic breakdown of counts and percentages.
Filtering allows you to hone in on specific subsets of data and get a better understanding of the nuances. It also helps identify trends that may be relevant to the bigger
picture.
Regression analyses determine what factors led to a particular outcome.
*Incorporate the questions related to your objectives: See table below. PRN

