It’s a traditional and increasingly irrelevant distinction to call something “man’s work” or “woman’s work,” but some gender distinctions continue. When they result in inequality they are wrong. Some differences, though, can be interesting, as in the comparisons about social media platform use (for example, on page 7 of this week’s edition).
Ditto Statista’s examination of who makes purchasing decisions, a man or a woman? In a nutshell, Statista found the answer to be based on what’s being purchased. And, yes, it found some purchases were men’s domain, others belonged mostly to women.
Predictable is Nice, Sometimes
The other factor that’s critical to marketers and communicators: Unlike the data about social media platform use mentioned above, where almost no patterns emerged to distinguish male from female preferences, the distinctions in purchasing decisions Statista found seem traditional and predictable. Communicators and marketers can relax, just a bit.
A caveat: 30% of the 10,000 U.S. adults, age 18-64, who participated in Statista’s Global Consumer Surveywere single (unmarried, divorced or widowed). This means the results don’t reflect relationship dynamics, Statista says.
Women Choose The Cuisine...
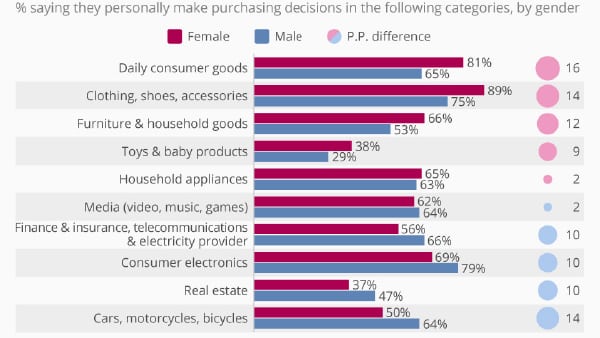
As you can see, the largest gap, the Statista survey found, was for daily consumer goods, which Statista says includes things like food and beverages. Oh, no, please don’t say, “A woman’s place is in the kitchen.” Yet, the data show 81% of women making the purchasing decisions when it comes to culinary choices. 65% of men say they decide on what to eat and drink.
And at The Clothes Shop...
It’s unlikely to be a surprise that women make nearly 90% of the purchasing decisions on fashion-related goods, such as clothing, shoes and accessories. On the other hand, 75% of men say they make the calls on those buys, which seems higher than expected.
We would have guessed the percentages to be a lot closer in the furniture & household goods category; they were 66% female, 53% males. Household appliances were nearly 50-50, as was media. Marketers and communicators, get back to work.