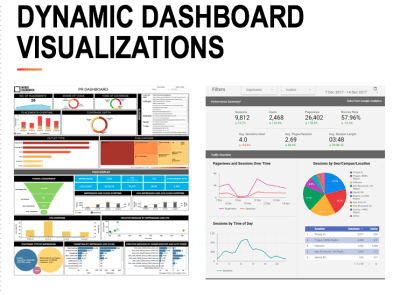
As measurement has become increasingly ingrained in the lives of communicators, the question becomes not just how to determine appropriate metrics for your company and collect data around them, but how to present that data in a way that is engaging and actionable. And contrary to popular belief, this doesn’t just mean making a pretty dashboard, but figuring out how to make the data on that dashboard leap off the page.
Allyson Hugley, president of measurement and analytics at Weber Shandwick, explains that “measurement is oftentimes the least interesting part of what we do, because it’s backward looking, it’s descriptive.” Just presenting the raw numbers will not help you unless you can ground it in a tangible benefit to the business. And one of the best ways to do that, Hugley says, is for “analysts to be part of the creative process and part of the business conversation.”

Hugley says that even as CMOs are now investing the highest portions of their marketing budgets toward analytics companies are still using less than one-third of their data to drive business decisions. The issue here being that data is increasingly viewed as something that companies should invest in, but the perception of it as an actual utility is remaining flat. “And eventually we’re going to reach a point of diminishing returns unless we internally can think how to be more creative with data and have it shift from being a highly invested-in asset that people just think of as a must-have…but get to a point where we’re investing in it because we actually understand that it can be monetized and create value for the business,” Hugley says.
Communicators need to get smarter in terms of how they think about aggregating data and having it tell a compelling story. This is where artificial intelligence comes in. “We are moving increasingly past the point where Excel sheets are going to be sufficient. Artificial intelligence is requiring us to digest and distill and make business decisions off of infinitely more vast data sets,” Hugley explains.
In fact, Weber Shandwick conducted a survey in 2017 in which 55% of CMOs expect artificial intelligence to have a greater impact on communications than social media going forward. So how can you better use AI to inform your communications strategies?
The first thing you can do is to not get overly micro with your analytics. At the start of the data wave companies were urged to gather most of their insights from data on individuals. Hugley says that we may have gone too far. “When we home in too much,” she says, “we risk losing perspective.” A combination of macro- and micro-insights is the best way to get a holistic view of trends around your company and your industry at large.
Automating and designing your reports is the next step to make sure your numbers are actually telling a story. The automation piece comes into play when you a) make sure your data are accurate, and b) make the process faster and more seamless so you can get to the actual deliverable chart faster. Try to go beyond just converting Excel sheets into static dashboards in PowerPoint, and use a tool like Tableau, which creates easy-to-read interactive charts. By integrating such a tool into Excel you can make sure your data is accurate and can be updated in real time, so it becomes more actionable. You might also consider creating your own infographics with an easy-to-use tool like Piktochart, so that data becomes something that almost anyone can play with and visualize in a compelling way.
Follow Hayley: @that_hayley
