While social media isn’t yet old enough to be considered conventional, several traditions and best-practices have developed.
In the ‘old’ days of social, which weren’t long ago, having the largest audience was almost all that mattered.
The industry has matured. While a gaudy audience figure still counts for something, the metric is just one of several savvy communicators and marketers use to assess a brand’s social media success. Generally, a best practice is to be wary of any effort that touts a single metric without surrounding context.
Many Metrics
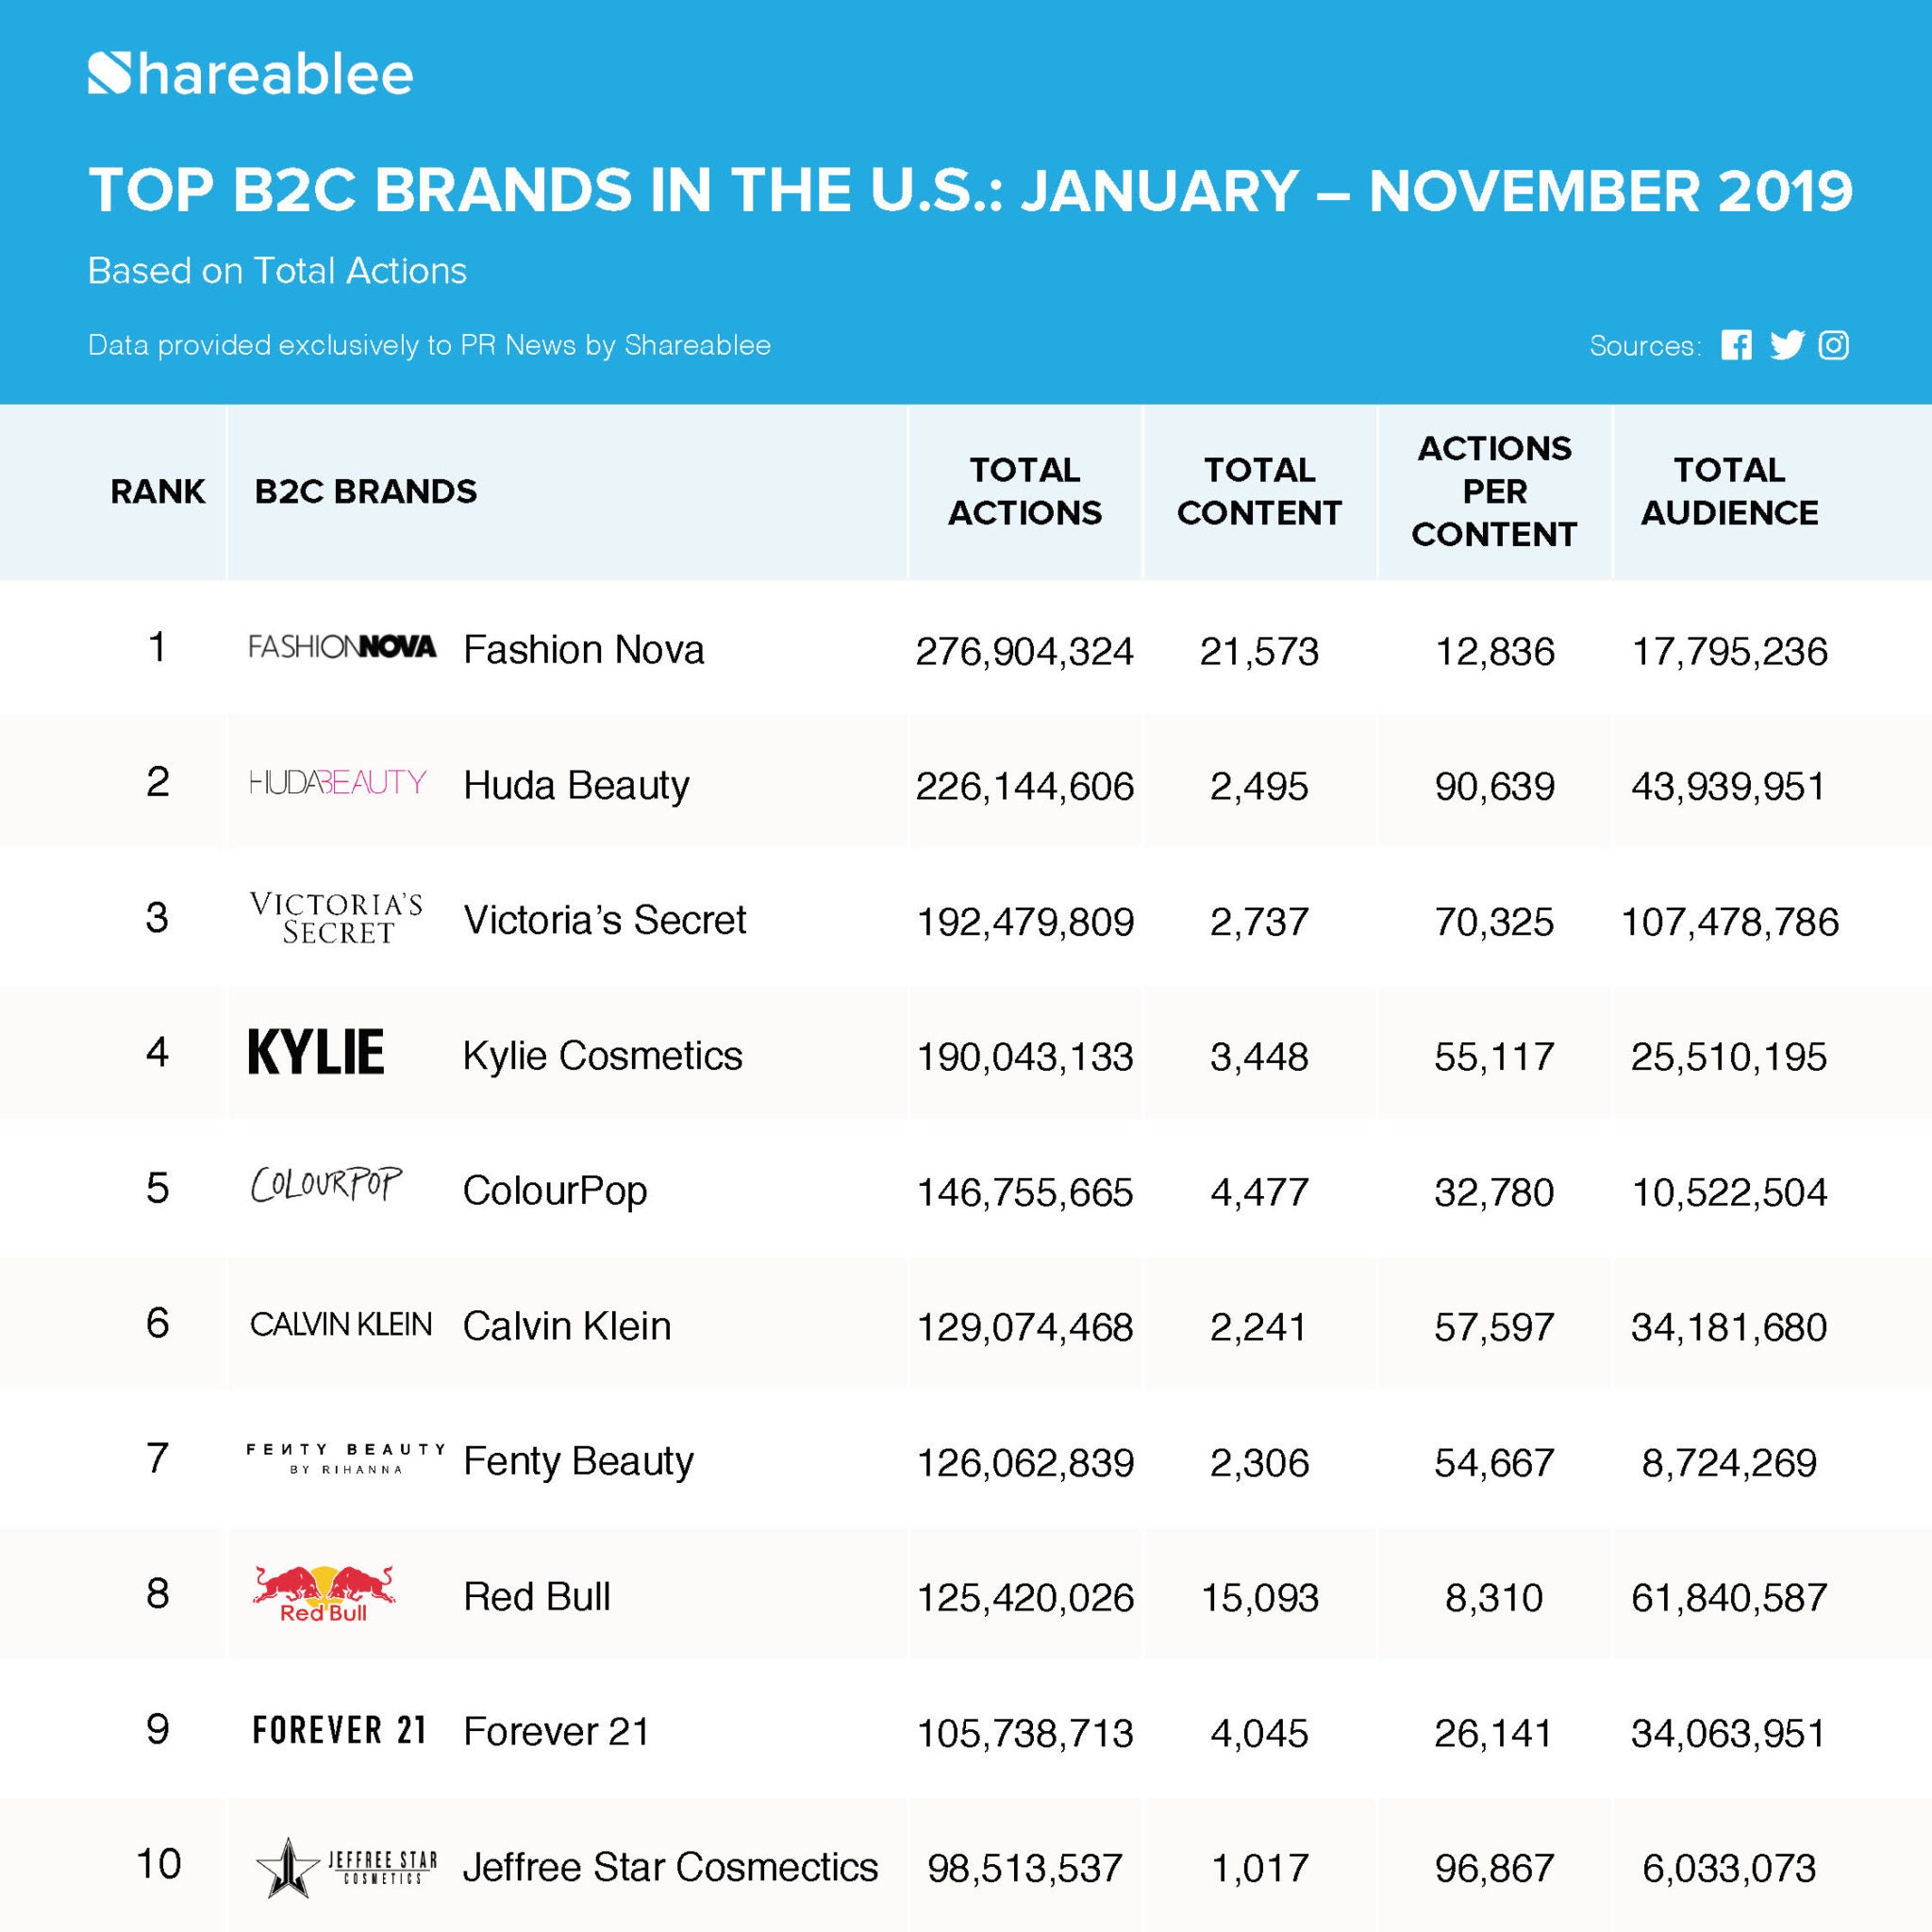
In the charts on pages 15 and 16, which data partner Shareablee provides exclusively to PRNEWS, you can see the importance of a large audience. Still, audience size during the first 11 months of 2019 (Jan. 1-Nov 24) is but one factor when it comes to the rankings of top social brands.
For example, Red Bull’s audience of 62 million dwarfs that of the top-ranked social brand, Fashion Nova (18 million), yet the energy drink is number 8 on our list in terms of actions, or consumer engagement.
In these charts, actions is defined as the sum of likes, retweets, comments and shares on Facebook, Instagram and Twitter.


Fashion Nova Takes Top Spot
Fashion Nova, the leader, combines a solid audience size with a plethora of posts (22,000) and it gets a very respectable number of actions per piece of content (13,000). Moreover, nobody is within hailing distance of its total consumer engagement figure.
By contrast, Red Bull posted fewer times than Fashion Nova, yet its average consumer engagement (8,300) per piece of content trailed that of Fashion Nova.
Of course, many brands would be more than satisfied to achieve Red Bull’s notoriety on social and its engagement figure. In addition, Red Bull moved up 5 places on this list of top social brands, year over date, says Shareablee marketing chief Herman Chen.
Its consumer engagement rose 34 percent across all platforms, with Twitter up 26 percent and Instagram rising 40 percent.
Consumer Engagement Off 10 Percent
As a category, reviews are mixed. Once again beauty and fashion dominated the top B2C 10 list. Yet there’s more reason for concern. The top 10 dominated, accounting for 25 percent of all B2C engagement, Chen says.
Another concern is the drop in consumer actions, year to date. B2Cs had 7 billion consumer actions during the 11-month period, which is a 10 percent decrease from the same period in 2018.
On a brighter note, B2Cs experienced a 10 percent rise in consumer actions on Twitter vs the same period last year.
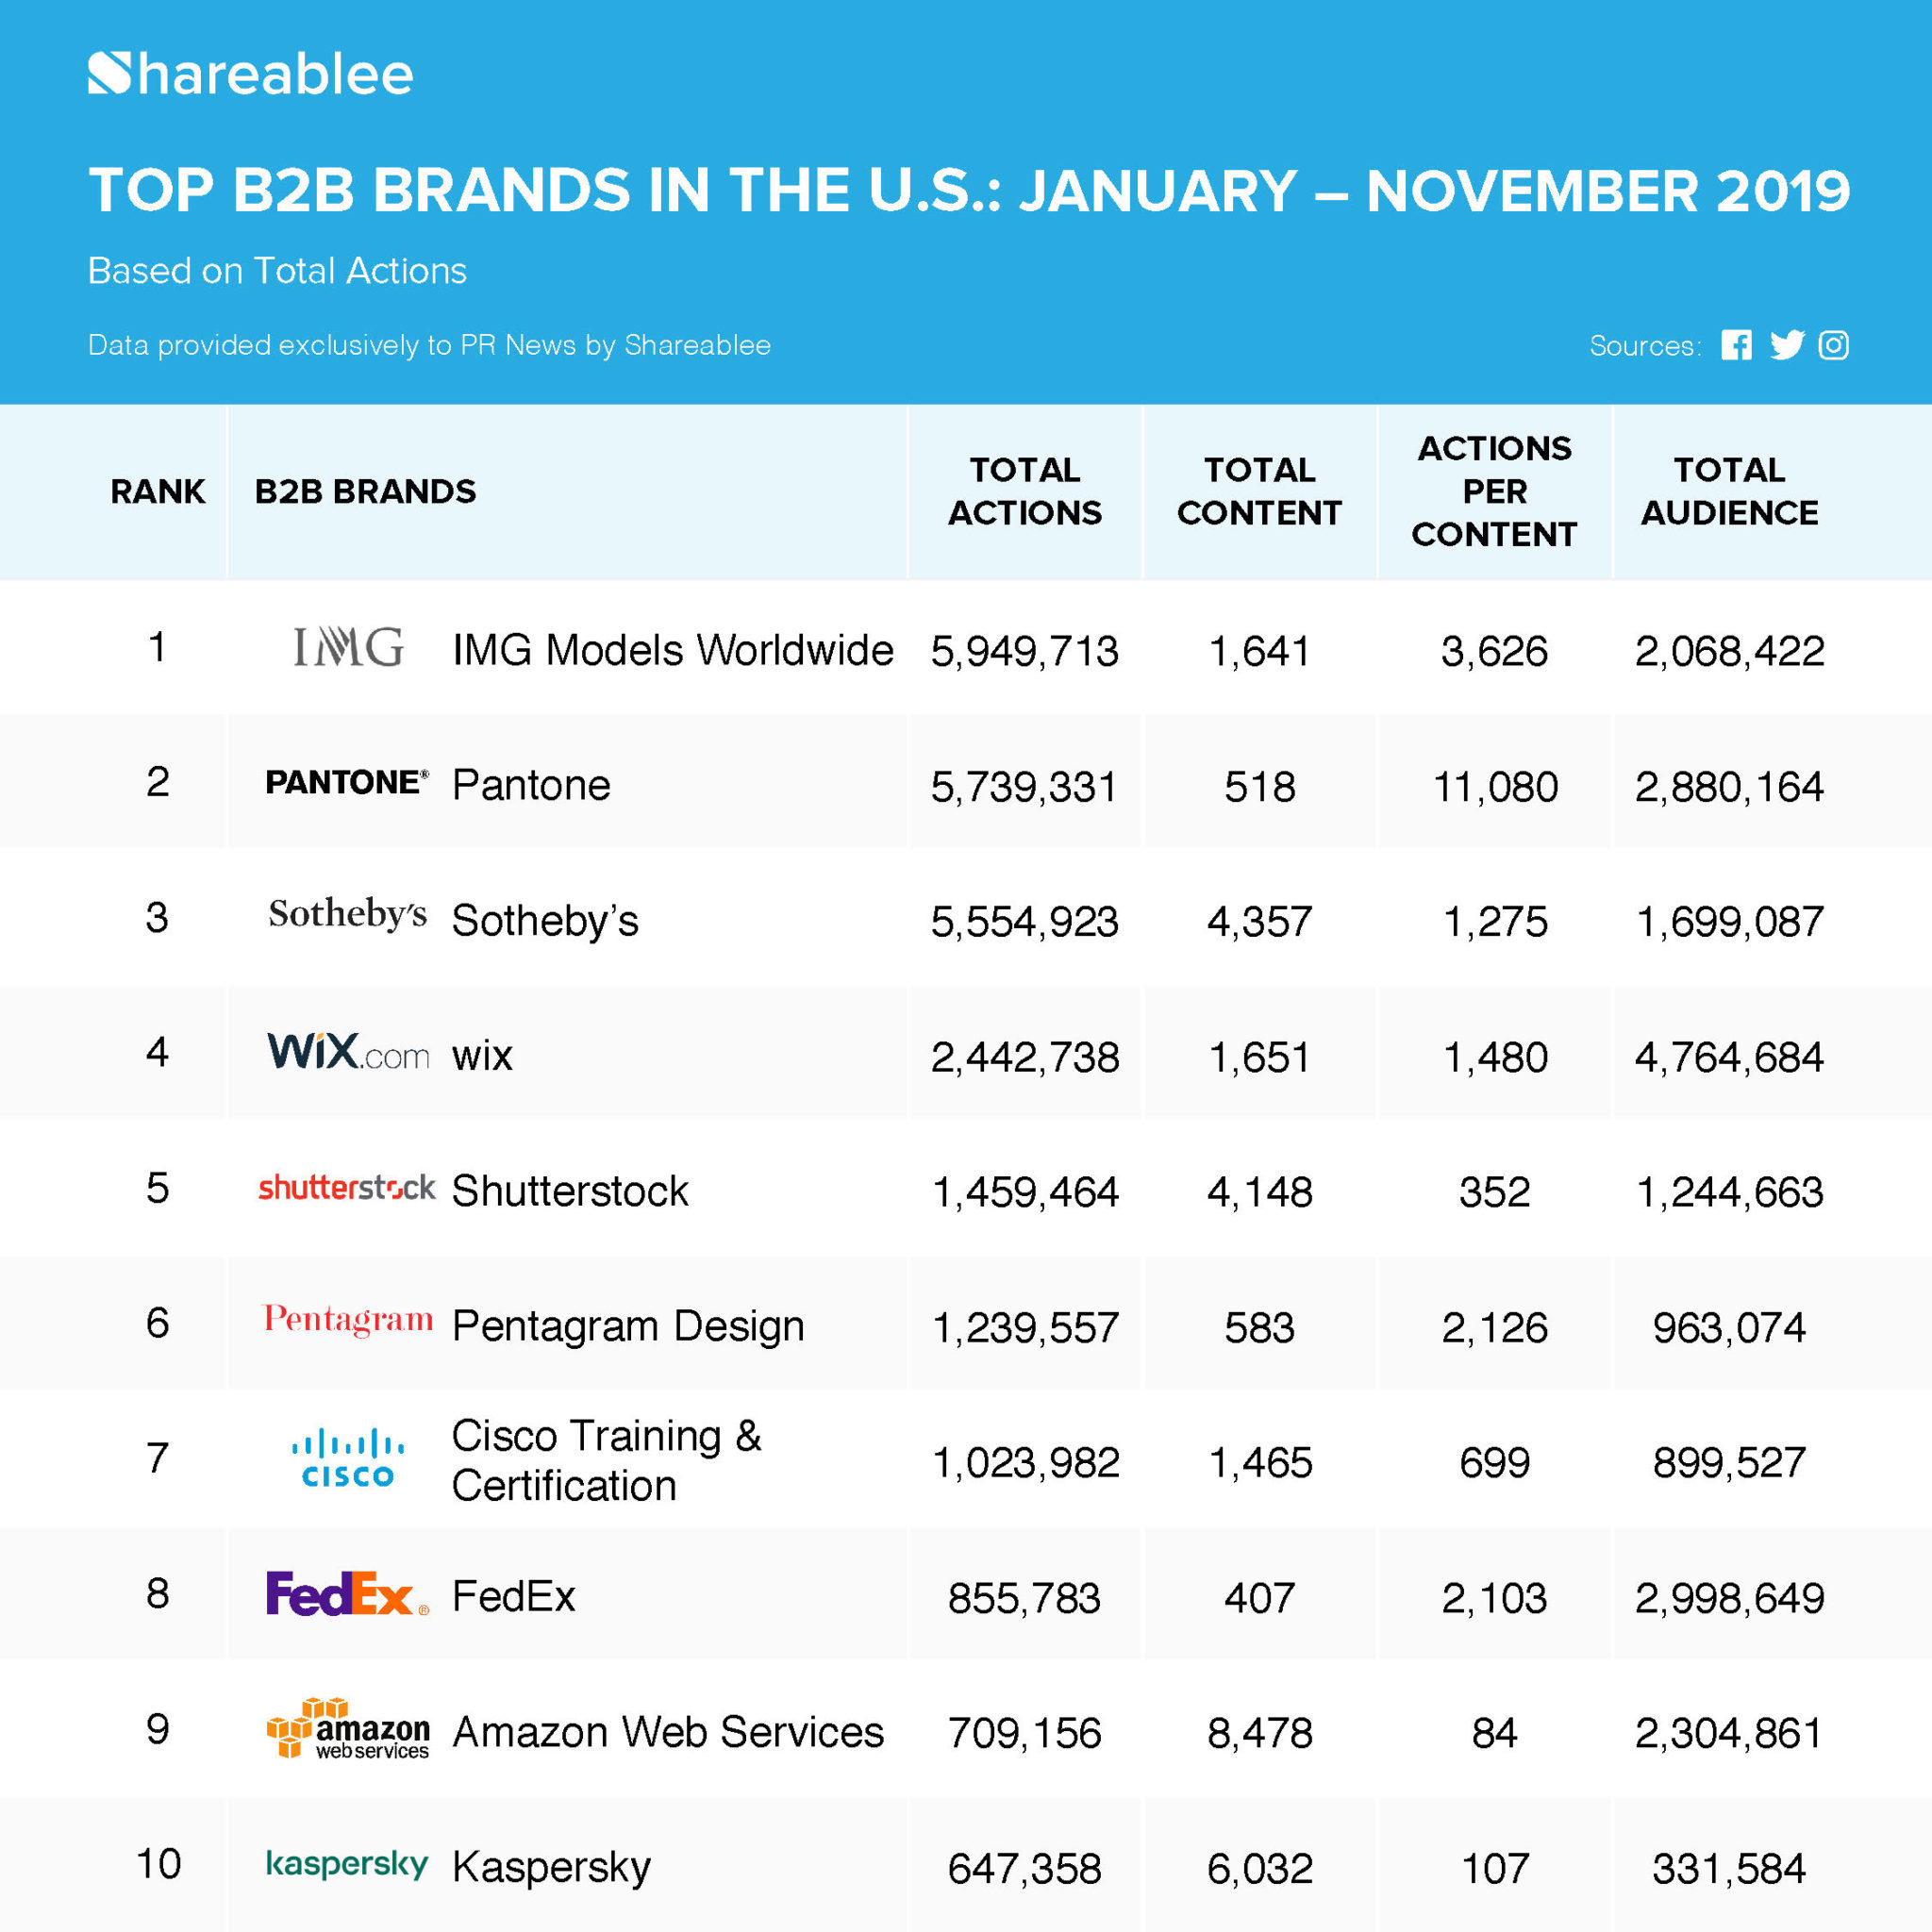
Moving to the next chart, about B2B brands, the race is much tighter between three perennial social media powerhouses: IMG Models Worldwide, Pantone and Sotheby’s. The total actions total of fourth place brand, Wix, is not close to number three Sotheby’s.
Looking at color company Pantone illustrates how it’s possible to succeed with a less-is-more strategy. Only FedEx posted fewer pieces of content during the period, yet Pantone wound up as number two on the list.
Its not-so-secret secret was averaging 11,000 consumer actions for every one of its 518 pieces of content. That was up 40 percent vs the same 2018 period. In addition, Pantone was consistent. Both its Facebook and Instagram pages enjoyed a 40 percent rise in consumer engagement.
Actions Off 30 Percent
The larger story in the B2B category is that consumer engagement was off 30 percent, Chen says.
As you might expect, figures for this category are vastly smaller than for the B2C sector. For example, B2Bs accumulated 74 million consumer actions during the period; B2C had 7 billion.
In addition to the leaders, two other B2B brands made big news. Cisco Training & Certification, which was outside the top 50 last year, moved into the top 10, with an increase in consumer engagement of 300 percent. Kaspersky had a similar story and increase.
CONTACT: herman@shareablee.com
