
When it comes to social media, things move quickly. IGTV just launched on June 20, and already brands are integrating it into their social strategies. And though social media marketing is vital to the success of any business, staying abreast of changing trends can be a challenge. As new features are released and user bases shift, what worked for marketers even six months ago may not work today.
To help communicators keep up, Pan Communications recently released an infographic of user and marketing data for Facebook, Twitter, Instagram and LinkedIn.
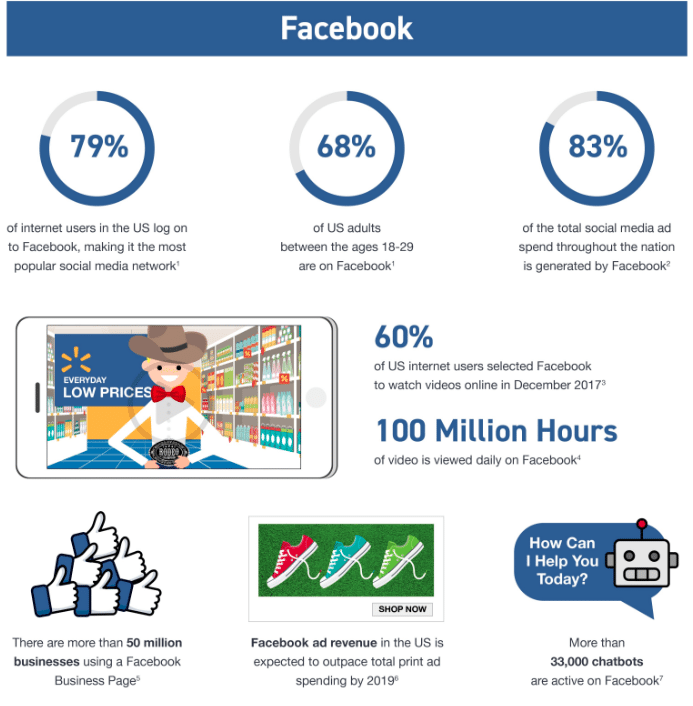
Things have certainly changed in the past year. Though Facebook remains the most popular social media network in the U.S. overall, it has become less popular with younger adults, for example. Only 68 percent of adults ages 18-29 spend time on Facebook, compared to 79 percent of internet users in general. But in spite of its shifting user base, Facebook is still one of the better platforms for marketers—ad revenue from Facebook is expected to outpace the total amount spent on print ads by 2019.
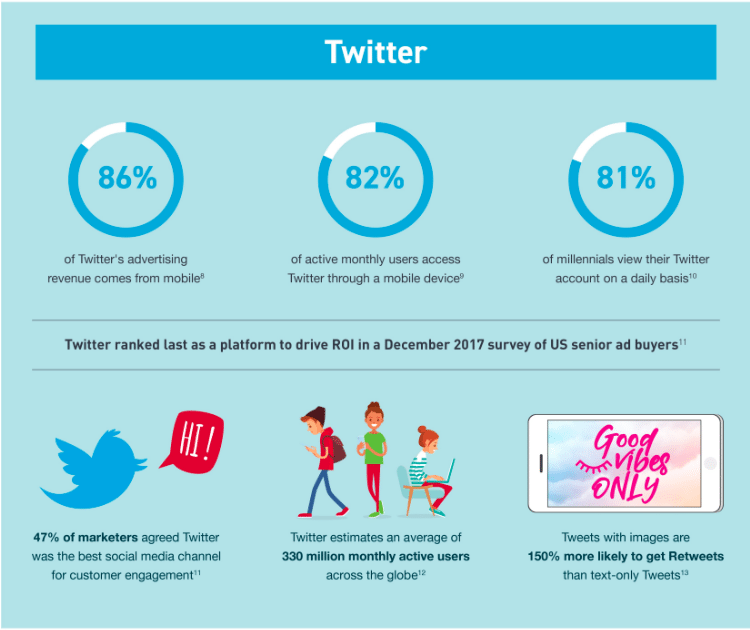
In terms of engagement, Instagram still comes out on top, generating the most per post of any social network out there. But nearly half of marketers believe that Twitter is the best social platform when it comes to engaging directly with customers. Twitter actually came in last on a Dec. 2017 survey of U.S. ad buyers when it comes to ROI.
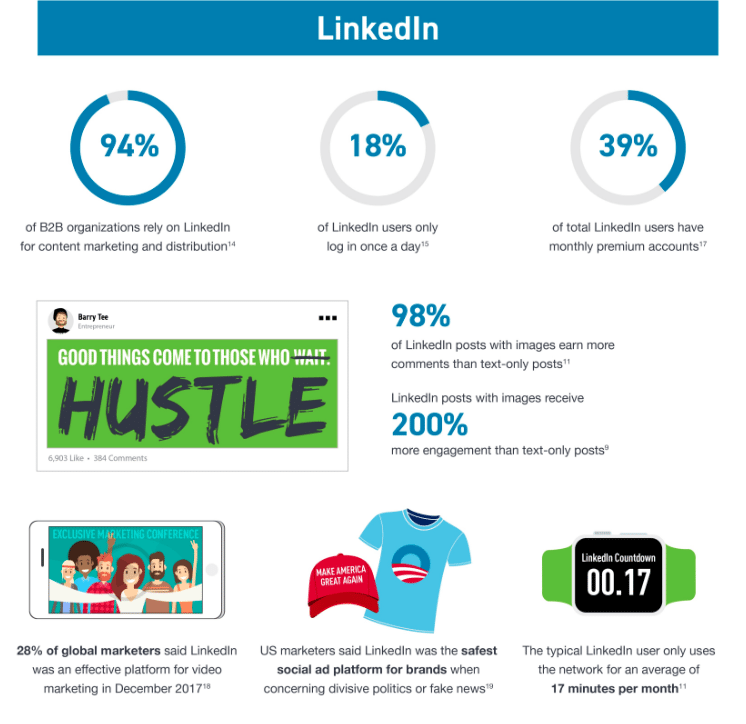
Perhaps most surprising is LinkedIn’s continued rise as a content marketing platform, particularly among B2B organizations (94 percent of which rely on the platform in their marketing strategies). And while a typical user only spends 17 minutes on average per month on LinkedIn, marketers are still finding success on the platform, particularly since it released its native video feature last summer. In December, 28 percent of marketers around the world said that they found video marketing on LinkedIn to be effective, and that number has likely increased over the course of 2018.
See the full infographic here.
Follow Hayley: @that_hayley