The ability to create an easy-to-read data dashboard is becoming an increasingly critical skill for communications professionals. But an attractive scorecard won’t do much good if it contains metrics that aren’t valuable for your company. But with so much noise on social media these days, how can communicators determine which KPIs are the most vital for their organization?
According to John Glinski, marketing analytics strategist at Vanguard, the key is to be proactive. By leveraging analytics, he says, you can “identify the most important signals relating to your brand.”
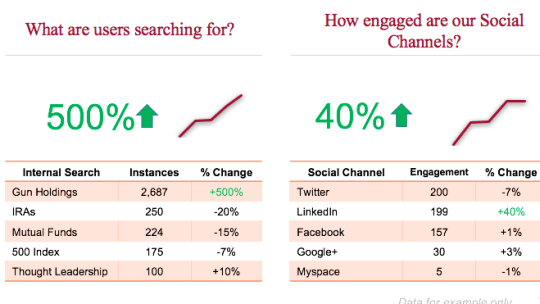
Using the timely example of the recent uptick in gun control debate in the U.S.—which has brought investment management companies like Vanguard under scrutiny in regards to gun stock holdings—Glinski explains that his team realized they needed a “tool to identify changing user behaviors relating to ongoing public sentiment” around guns. By proactively creating a customized digital signals tool, Glinski says, they were able to monitor consumer behaviors in real time.
Glinski lays out the following three steps that any communicator can use to create a digital signals tool for their brand:
Step 1: Identify Your Areas of Focus
There are three basic questions that all PR professionals should ask about your company’s digital properties on an ongoing basis, Glinski says:
- How are users accessing your website, and has that changed?
- Have there been changes in search terms among users on your website?
- Has engagement on your social channels increased or decreased?
From there, determine which analytics reports will provide the answers. For example, to determine how users are accessing your site, Glinski advises including a referring domain metric on your dashboard. The second and third questions can be answered with an internal search terms report and a social engagement report, respectively.
Step 2: Create Your Signals Dashboard
Glinski explains that Vanguard used Adobe Analytics to create their signals tool, but Google Analytics is also a popular choice because it is free to use. Continue to focus on your key questions and you will be able to develop a simple, valuable and effective dashboard for your brand. “Whatever your tool is,” he says, “this is completely possible.”
Step 3: Putting It Into Practice
Though the analytics team is separate from the PR team at Vanguard, Glinski says that collaboration was crucial for putting the digital signals tool into practice.
Vanguard's analytics team conducted interviews with the PR team, which allowed them to customize the scorecard in a way that would bring value to the company. They also hosted training sessions with the PR team to make sure that the team “understood the data that was coming in, what the KPIs were that we were focusing on and how to read that data.”
And since learning and adapting to a new system can be a challenge, Glinksi and his team set up real-time email alerts that would be sent out any time a deviation from the norm occurred on one of their KPIs. This allowed both teams to work together to determine what was causing an anomaly and whether or not it was something they should pay attention to or fix.
Glinski says that integrated marketing effectiveness is paramount to the process, as is determining how you can leverage your available channels to respond to data appropriately. Perhaps you can craft target emails for those who searched specific keywords on your website. Or maybe you can shift your social media strategy based on sentiment you’ve noted among your user base. You might even consider reaching out to publications you’ve identified through your referring domain report based on earned media you’ve received there.
“It’s important not to overreact to data,” Glinski concludes, “but it’s also important to make sure it is part of your process.”
Follow Hayley: @that_hayley