
It’s been said a picture is worth a thousand words. But how much is that Instagram picture you just posted worth to your brand—whether it’s your corporate or personal account?
One way to determine how your content resonates with followers is to use an analytics tool to help audit the content you’re sharing, determine the level of engagement you’re driving and optimize future posts. With communications becoming increasingly more visual, making the most of a social media platform built around imagery is a must for any communications pro.
While Instagram doesn’t offer built-in analytics reporting as some other platforms do, you can still access meaningful data using free third-party tools such as SimplyMeasured and Iconosquare, among others. It’s not enough to know how many likes or comments each of your posts garners—what’s most compelling is the next-level data you can glean using analytics tools.
For our purposes here, I will explore the analytics available on my personal Instagram account (@LZone) using Iconosquare’s free tool, although a more robust version is available for a fee. Iconosquare is useful for brand and personal accounts alike. I recommend you use the tool first on your personal account, then apply what you learn to improve the company page (or pages) you manage.
THE BASICS
When you log on to your Iconosquare profile, look at the navigation in the middle of the page on the left, which includes:
Overview: This helps you understand how many followers you’ve gained or lost over time, how many followers like your posts on average, how many comments you generally receive and how many people outside of your network generally like your posts (i.e., how many non-followers are finding your content some other way). The latter is especially meaningful insight if you’re managing a brand page. How can you get those non-followers more engaged with your brand?
Rolling-Month Analysis: This provides a snapshot of how much you’re posting month over month, the content that’s getting the most activity, who has followed (or un-followed) you and your most engaged followers. Again, this last data point is particularly relevant to community managers, since you can get a real-time glimpse into your most active brand ambassadors, which might inform your future influencer campaigns.
Content: In this area you can study things like density (which day of the week you post on most often, or what time of day you’re generally most active), filter usage (as it turns out, the Amaro filter, which lightens dark photos, is a big winner for me) and tag usage (I use hashtags about 34% of the time).
While these metrics all are useful, I find the most insightful ones are farther down the navigation panel: Engagement, Optimization and Brand Index. Let’s explore each of these in a bit more detail.
ENGAGEMENT
Social media without engagement is like walking into a networking event and just yelling about yourself without actually talking to anyone. What really matters is the conversation between two people—whether that other person is a company (corporate brand) or an individual (personal brand).
The analytics I find most useful in this section are the “most liked media, ever!” and “most commented media, ever!” These two charts provide rich insight into what kinds of posts resonate most with followers.
I wasn’t surprised to see that all of my top five “most liked” posts are pictures of my 4-year-old niece, who is undergoing chemotherapy treatments. They all are celebration posts for milestones or special events in her journey. What I was surprised to see was that three of my top five “most commented” posts were pictures asking my followers to vote on which outfit/fashion accessory they liked between two.
What does this tell me? I have found two strong ways to engage with my followers: by creating an emotional connection or asking for opinions. That same logic can be applied as you review the engagement on your corporate page, which will help you fine-tune your content calendar to reflect what your community is most interested in seeing.
OPTIMIZATION
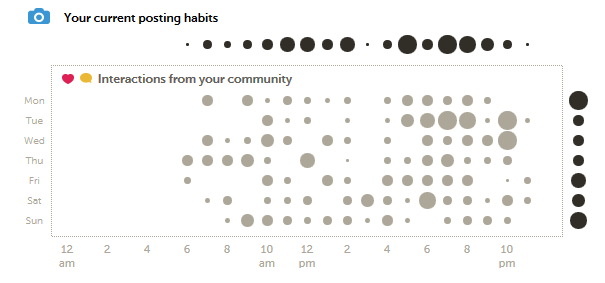
In my opinion, the optimization data is by far the most insightful information to help better engage with followers. The first chart you’ll see in this section should resemble the one below. What does it indicate? It provides insight into when my community most often engages with my content as compared to when I’m most often posting. In essence, it’s telling me the best time(s) to post.
Judging by this chart, to maximize interactions with my followers, I should be posting content mostly on Tuesday and Wednesday evenings (where the gray circles on the chart are largest). But I’m posting most often on Mondays in the late afternoon or early evening (where the top black circle on the vertical axis [Monday] is largest). I should be more mindful about sharing important content when my community is most actively engaged. In the same way, brands can use this insight to seek ways to better reach followers, which is critical as more and more brands use Instagram to compete for the hearts, minds—and eyes—of customers.
BRAND INDEX
This is a new feature of Iconosquare, and one that offers meaningful insight for any marketing or communications professional. As defined by Iconosquare, this section can help you:
- Identify brands doing the best job of sparking interest and conversation
- Sort brands by number of followers/hashtag popularity
- Narrow down your competitors within categories
- Get a detailed analysis of each brand’s profile page
There is a lot to learn from this “best of” (and, in some cases, “worst of”) list of companies and celebrities. While most of the featured companies are B2C, nearly any B2B company also could glean meaningful insight about how consumer brands are best optimizing their social media presence—and apply those findings to their industrial business.
CONCLUSION
There are certainly a number of other ways to slice and dice Instagram analytics to determine how to make the most of your brand’s account. The challenge is to spend some time looking at the data to understand how and what gets your followers engaged, and to determine the roadmap to optimize your corporate or personal Instagram page.
CONTACT: @LZone
This article originally appeared in the October 19, 2015 issue of PR News. Read more subscriber-only content by becoming a PR News subscriber today.