
Do you use Twitter Analytics? You should. Twitter Analytics can provide a lot of meaningful data to help you enhance and amplify your personal Twitter brand. But it can also be a little overwhelming, especially if you don’t live and breathe analytics as a full-time job. Here, I’ll share data I found most useful as I sought to explore how to make the most of my personal Twitter brand using data and analytics. You may find other metrics more meaningful for you. For the purpose of this piece, I lived in my Twitter analytics for an 18-day period to identify trends and takeaways that helped me better understand my personal brand, and apply those same findings to my role as a brand and client counselor.
1. YOUR AUDIENCE
Perhaps the most obvious first step is to analyze your followers. Imagine walking into a cocktail party and just spouting off the first thing that came to mind, without concern for who was in the room or what they would want to hear.
The same holds true for your Twitter account. If you do a quick audit of your followers, you’ll understand why they probably followed you in the first place, and what will keep them coming back for more.
Go to the “Followers” tab in Twitter Analytics and look at the “Interests” column. When I did, I (unsurprisingly) learned that a combined 52 percent of my followers are interested in marketing, advertising or SEO. What surprised me, however, was that a full 20 percent of my followers also are interested in cookbooks, food and red wine.
Likewise, I learned that an equal number (40 percent) of my followers are interested in comedy, business and news. Why is this important? Because it helps me think about what content will resonate with those who followed me for professional versus personal insight.
The Followers tab also can offer insight into which geographic regions most of your followers hail from, their gender and who else they follow. This can be especially powerful when seeking ways to better connect with followers, since you can extrapolate the data to build personas around the types of followers you have.
2. INFLUENCERS
The sad truth about Twitter is you reach a small percentage of your followers with each piece of content you tweet. That’s why it’s a best practice to repost and repurpose your strongest content over the course of days, weeks and months.
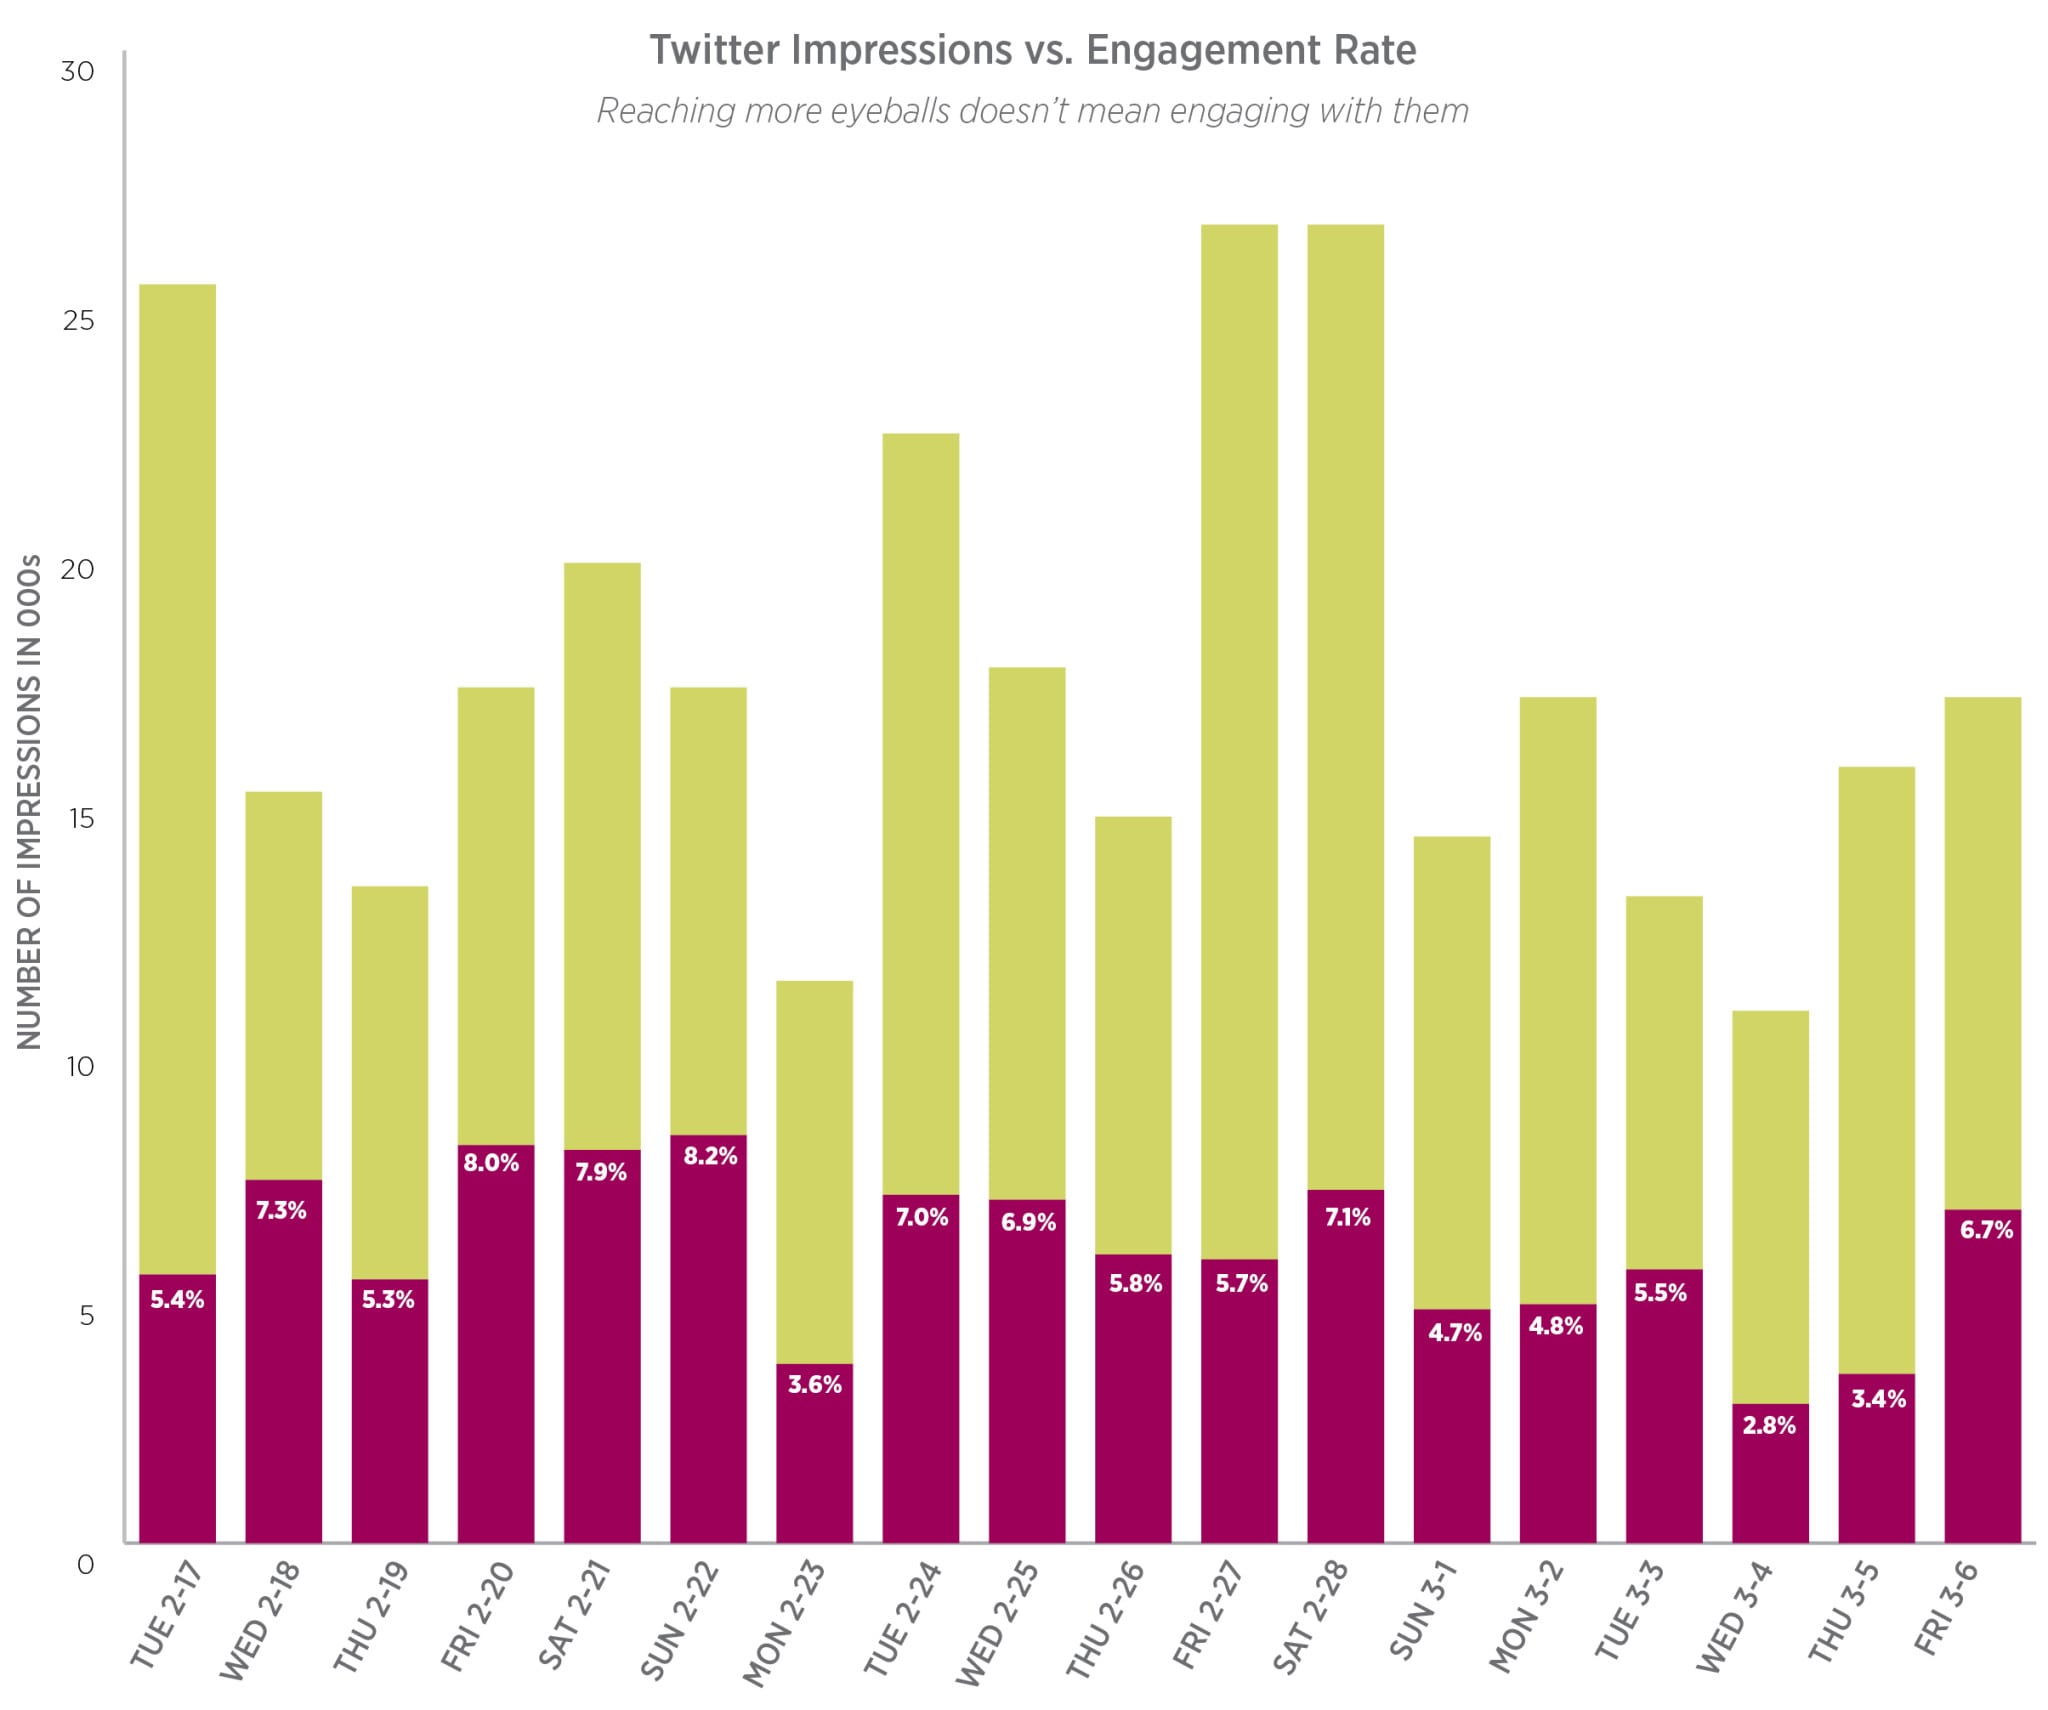
But you can use Twitter Analytics to determine how many people you’re reaching (impressions) and how many of them engaged with your content (engagement rate).
3. CONTENT
Of course, analyzing engagement data will tell you what content resonates most with your audience. For me, I found it varied by time of day, day of week and, of course, content.
The topics I found resonated most were a cross-section of what I’ve built my personal brand around: women’s leadership, marketing, world news and family. Interestingly, most of my best engagement happened leading into or over the weekend. Of course, I would be remiss if I didn’t also try to understand what content my followers dislike.
To provide balance, I took a look at my five lowest-performing engagement days (ranging from 2.8 percent to 4.8 percent engagement rates) and now have a much better idea of what content my followers could probably do without.
Courtesy: Dix & Eaton
4. WHEN TO POST
The five days I had the most Twitter engagement?
• Wednesday (February 18)
• Friday (February 20)
• Saturday (February 21)
• Sunday (February 22)
• Saturday (February 28)
By and large, I still have high engagement on the weekends, but Tuesdays and Wednesdays also are strong engagement days for me. What did I learn?
• Even work-related content does well on weekends. My conclusion? Folks who follow me are busy during the week and often get caught up on work-related content on the weekends. So, I should continue posting work- or industry-related content on weekends.
• If I have an important work- or industry-related piece of content, I should make sure it’s tweeted (for the first time) on a Tuesday or Wednesday.
The point is that you need to immerse yourself in data and analytics to understand not only how to create your personal brand, but also to build the brand for your company or clients.
Increasingly, any PR or communications person worth his/her salt needs to be able to understand, analyze and act upon the digital data that is right at their fingertips.
CONTACT:
Lisa Zone is managing director of Dix & Eaton. She can be reached at [email protected]
This article originally appeared in the April 27, 2015 issue of PR News. Read more subscriber-only content by becoming a PR News subscriber today.