 You can meet people much easier. Ditto for building relationships. It’s a solid vehicle to engage and interact with peers, clients and industry experts. These are just a few of the responses from PR pros when asked about the best thing about social media. On the flip side, in terms of the worst thing about social media, PR pros said it doesn’t always tell the story; it doesn’t allow for deep conversation and it is time consuming. Oh what a tangled Web we weave, at least when it comes to how brands and organizations can monetize social channels and make them a more valuable aspect of their overall communications strategy.
Both questions were part of recent survey on social media conducted by PR News and Cision. The survey garnered nearly 300 responses from PR pros working in a wide range of industries, including banking, healthcare, media, software, technology and, of course, communications.
As the tectonic plates of PR continue to shift, there’s a growing onus on communicators to align their social platforms with their company’s overall financial goals.
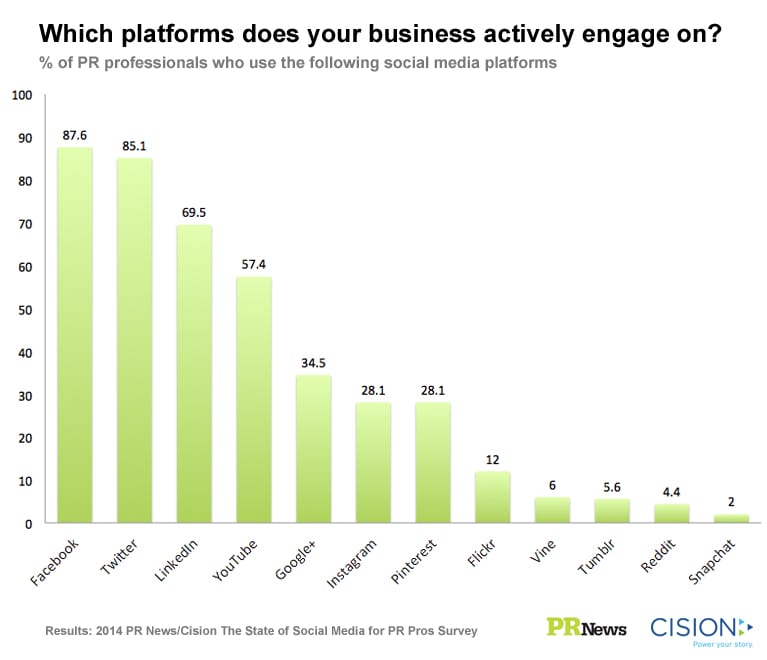
In that regard, it seems like most communicators have developed a comfort zone with Facebook and Twitter.
And while the penetration rates remain low, PR pros are starting to use some of the newbie social channels, such as Vine (6%), Reddit (4.4%) and Snapchat (2%).
Cavan Reagan Reichmann, director of social engagement at Spong, stressed that he was a bit surprised that more brands aren’t deploying Twitter for paid promotions.
The microblogging site, he said, has become much more scalable in recent months, boosting its ability to reach a wider audience.
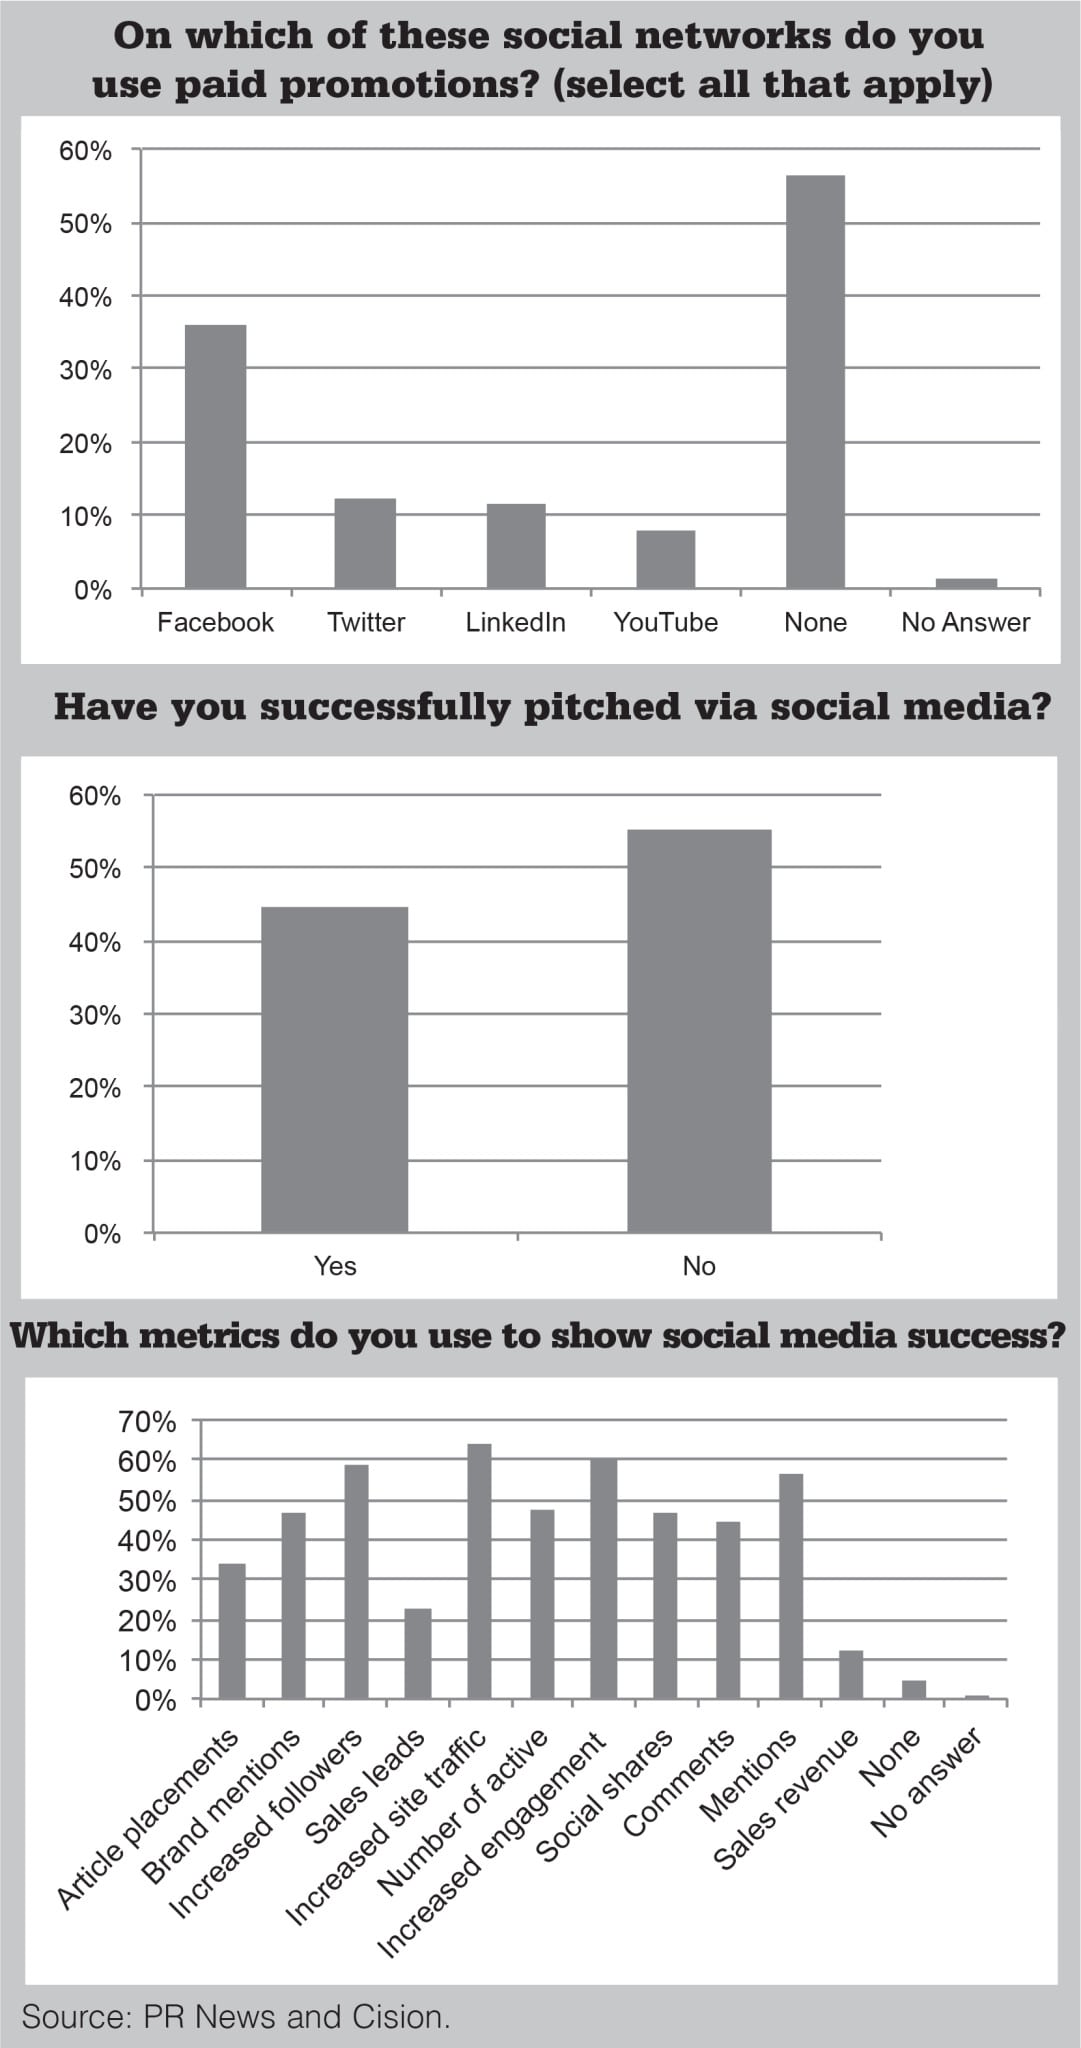
According to the survey, PR pros are using a variety of metrics to show social media success, foremost among them increased site traffic and rising engagement.
Brandon Andersen, director of marketing at Cision, said it’s encouraging for PR pros that increasing website traffic now tops the metrics that are being used to demonstrate the value of social media, compared with previous years when followers and mentions topped the list.
“In social media, we are starting to look at marketing-like metrics, but sales leads and sales revenue are still low” per the survey, he said.
He added: “As the converged media environment continues to take shape, an emphasis on sales revenue and getting consumers through the sales funnel will become more important.”
But such metrics may not materialize without first cultivating relationships.
“For me, [social channels are] an organic way of continuing and growing a relationship,” said Betsy Aldredge, director of media relations at the Museum of Jewish Heritage, “but I wouldn’t reach out to someone on Facebook or Twitter if I didn’t already know her.”
Here are some more stats from the PR News/Cision survey on the state of social media:
1. Which industry or industries do you (or your clients) specialize in? (select all that apply)
a. Agriculture = 3.2%
b. Banking = 8%
c. Basic Materials = 0.4%
d. Capital Goods = 1.2%
e. Chemicals = 1.6%
f. Clothing = 3.2%
g. Communications = 26.5%
h. Construction = 6%
i. Consumer Durables = 6%
j. Consumer Non-Durables = 2.8%
k. Credit = 2.8%
l. Drugs = 2.8%
m. Electronics = 4%
n. Energy= 6%
o. Entertainment = 5.2%
p. Food and Beverage = 8.8%
q. Government = 13.3%
r. Hardware = 1.2%
s. Healthcare = 18.5%
t. IT Services = 8.8%
u. Information Technology = 7.2%
v. Insurance = 6%
w. Investing = 2.8%
x. Media = 15.7%
y. Medical Facilities = 1.6%
z. Metals and Mining = 1.2%
aa. Real Estate = 4.8%
bb. Services = 22.8%
cc. Software = 6%
dd. Technology = 19.3%
ee. Transportation = 7.2%
ff. Utilities = 3.6%
gg. No Answer = 8.4%
2. Which platforms does your business actively engage on? (select all that apply)
a. Twitter = 85.1%
b. Facebook = 87.6%
c. LinkedIn = 69.5%
d. Google+ = 34.5%
e. Instagram = 28.1%
f. Pinterest = 28.1%
g. Tumblr = 5.6%
h. YouTube = 57.4%
i. Flickr = 12%
j. Snapchat = 2%
k. Vine = 6%
l. Reddit = 4.4%
m. None = 4%
n. No Answer = 1.2%
3. On which of these social networks do you use paid promotions? (select all that apply)
a. Facebook = 36.1%
b. Twitter = 12.4%
c. LinkedIn = 11.6%
d. YouTube = 8%
e. None = 56.6%
f. No Answer = 2%
4. Have you successfully pitched via social media?
a. Yes = 44.6%
b. No = 55.4%
5. Whose recommendation do you trust the most? (Ranking 1-5, 1=least trustworthy, 5 most trustworthy)
a. Family:
i. 1 = 7.2%
ii. 2 = 8%
iii. 3 = 20%
iv. 4 = 31.3%
v. 5 = 33.3%
b. Friends:
i. 1 = 3.2%
ii. 2 = 6%
iii. 3 = 17.7%
iv. 4 = 50.2%
v. 5 = 22.9%
c. Online crowdsourced reviews (Yelp, Amazon)
i. 1 = 8.8%
ii. 2 = 11.2%
iii. 3 = 46.2%
iv. 4 = 26.5%
v. 5 = 7.2%
d. Digital influencers (online journalists/bloggers)
i. 1 = 6%
ii. 2 = 15.7%
iii. 3 = 38.6%
iv. 4 = 31.3%
v. 5 = 8.4%
e. Traditional influencers (print journalists)
i. 1 = 3.6%
ii. 2 = 12.9%
iii. 3 = 35.7%
iv. 4 = 34.5%
v. 5 = 13.3%
6. If you see the same article in the mediums below, which do you trust the most? (Ranking 1-5, 1=least trustworthy, 5 most trustworthy)
a. Blog post
i. 1 = 12%
ii. 2 = 20.5%
iii. 3 = 46.6%
iv. 4 = 17.3%
v. 5 = 3.6%
b. Print Media
i. 1 = 5.6%
ii. 2 = 9.6%
iii. 3 = 20.9%
iv. 4 = 38.6%
v. 5 = 25.3%
c. Online article from print publication
i. 1 = 1.2%
ii. 2 = 8.4%
iii. 3 = 22.9%
iv. 4 = 49%
v. 5 = 18.5%
d. Online-only outlet
i. 1 = 3.2%
ii. 2 = 19.3%
iii. 3 = 47.8%
iv. 4 = 23.6%
v. 5 = 6%
e. Social media update
i. 1 = 10.4%
ii. 2 = 22.9%
iii. 3 = 38.2%
iv. 4 = 22.1%
v. 5 = 6.4%
7. Which metrics do you use to show social media success? (select your top 3)
a. Article placements = 34.1%
b. Brand mentions = 46.6%
c. Increased followers = 59%
d. Sales leads = 22.9%
e. Increased site traffic = 64.3%
f. Number of active followers = 47.4%
g. Increased engagement = 60.6%
h. Social shares = 46.6%
i. Comments = 44.2%
j. Mentions = 56.2%
k. Sales revenue = 12.4%
l. None = 4.4%
m. No answer = 1.2%
CONTACT:
Betsy Aldredge, [email protected]; Brandon Andersen, [email protected]; Cavan Reagan Reichmann, [email protected].
This article originally appeared in the June 2, 2014 issue of PR News. Read more subscriber-only content by becoming a PR News subscriber today.
One response to “Survey: Mixed Bag on Pitching Via Social Media Channels”