
Many communicators assume social media and influencers are influential to some degree on peoples’ decisions. The more important questions: How influential are they? Which demographic groups are influenced most? And do people value the advice of influencers and what they see on social media equally across the board? In other words are there particular sectors where social media content and influencers’ advice carries the most weight?
A report released today from the Institute of PR (IPR) attempts to answer some of those questions. Its authors, Dr. Tina McCorkindale, IPR’s president/CEO, and Dr. Marcia DiStasio, an associate professor at University of Florida, surveyed nearly 2,000 people, to draw its conclusions, the summary of which are summarized in the infographic below.
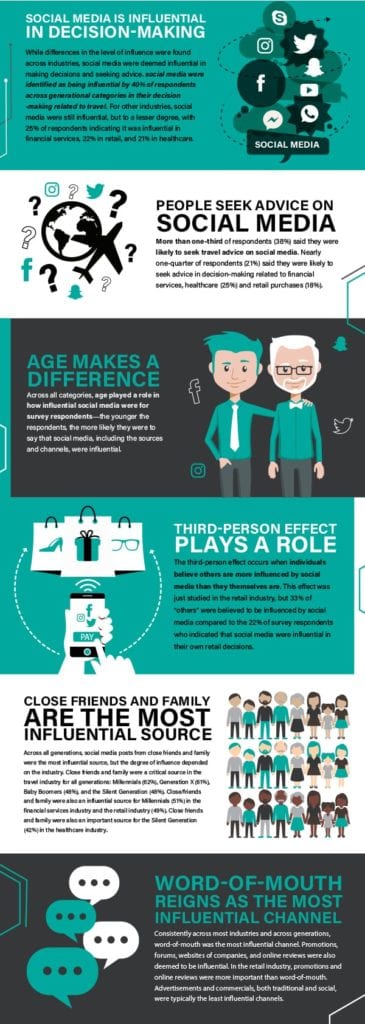
In short, the report found social media influences people, although there are differences among age groups, as might be expected. Nearly half (40%) of respondents across generational categories said social media influenced their decision-making related to travel, for example. Concerning other industries, perhaps those that arguably could be called more serious than travel, social media was still influential, but to a lesser degree. The study looked at social influence in travel, financial services, retail and healthcare. 25% said social was influential in financial services, 22% in retail and 21% in healthcare.
All social posts are not created equal, though. Across all generations, social media posts from close friends and family were the most influential, but the degree of influence depended again on the industry.
Consistently across most industries and generations, word-of-mouth took the top spot as the most influential channel. Advertisements and commercials, traditional and social, were typically the least influential.
Does the fact that an influencer has many followers make a difference when people are assessing that influencer’s advice? Only in the travel industry, the report says (see chart, below).
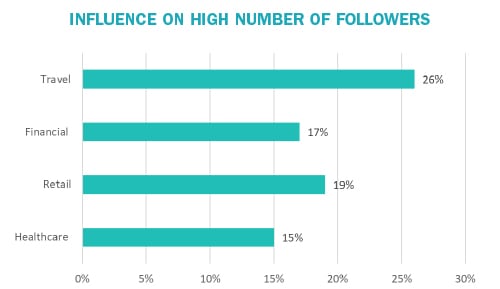
CONTACT: [email protected]