As communications professionals, a significant part of our job is to tell well-developed stories that engage target audiences. With recent research suggesting that brands have less than four seconds to hold consumers’ attention on a web page before they move on, it’s important now more than ever to consider the various vehicles to tell our brands' and clients’ stories in a compelling way.
To do just that at Text100, we’ve introduced visual storytelling tools—from infographics to video to animations and more—to all our B2C to B2B clients, both big and small.
For example, Adobe was challenged with presenting the results from its email usage consumer survey in a way that captured various audiences’ attention, ensured message penetration and raised awareness for Adobe Campaign, its email campaign platform.
Visual Storytelling for Adobe
For the survey results, which included insight on how U.S.-based white-collar workers use email, Adobe wanted to not only highlight key findings, but also tell a visual story with the data that resonated with several different audiences: consumers, business executives and managers, as well as marketing professionals.
The end result needed to counter current misperception about how email usage was slowing down with the advent of new communication tools such as video conferencing and Slack; Adobe’s data actually showed that the average American spends six hours a day checking email. Additional key messages to highlight included: email will remain a cornerstone of workplace culture; email is causing “FOMO”; email obsession is affecting personal interactions; and finally, Americans look to email detox.
To successfully fulfill these goals, Text100 advised Adobe to develop two different infographics with varying design approaches and messaging.
Bringing Data to Life for Different Audiences: Creating Each Infographic

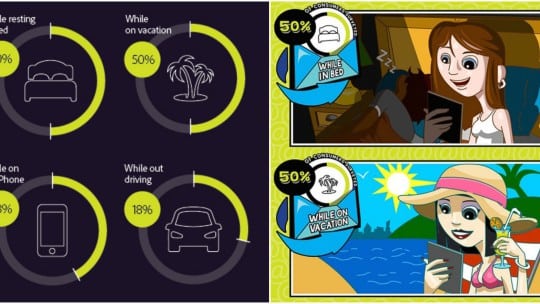
The Text100 design team decided to take different tonal approaches both in copy and design to tell essentially the same story. Despite the varying approaches, both infographics needed to be connected to one another and to the Adobe brand, which the team did through shared use of iconography and color.
For “Subject: Email, we just can’t get enough,” initial sketches were done in pencil. The team used Adobe InDesign to create rough framework layouts, and the final design was produced using Adobe Photoshop, Adobe Illustrator and Adobe InDesign.

And for “The Power of the Inbox,” rough sketches were done in pencil, then a set of refined pencil art before using a Wacom tablet and stylus to illustrate the finished illustrations in Adobe Animate. The final layout was done using Adobe Photoshop and Adobe InDesign.
"Subject: Email, we just can’t get enough,” was designed and written with a sense of formality. While “The Power of the Inbox” was designed, illustrated, and written in a more whimsical sense with a bit more storytelling.
Ultimately, the “Subject: Email, we just can’t get enough,” infographic was picked up by several business and marketing outlets like Forbes, while the second infographic, “The Power of the Inbox,” was exclusively picked up by Inc.
Post-Campaign Assessment
While both infographics accomplished Adobe’s goals, there were several key takeaways from the campaign.
The biggest takeaway when creating multiple infographics is to ensure that the look and feel are uniquely different to appeal to various audience types, including reporters. From a design perspective, both of the design approaches lend themselves well to having animated elements within them.
Moreover, even though media may not necessarily be your end audience, it’s always important to factor them into the picture. For the next project, the team could consider working with reporters to determine which data they would be most interested in seeing represented visually.
Overall, the team’s approach to visual storytelling elevated Adobe’s survey data in a unique and compelling way. Despite the challenges, the team found ways to ensure polar audiences were not only aware of the brand, but also engaged with the content. Whether it’s a B2C or B2B brand, with the right strategy intact, visual storytelling can be an effective tool for reaching key audiences.
Albert Lewis is head of creative at Text100 North America.